Custom dashboard development
Dashboards people check every morning, because the numbers are right.
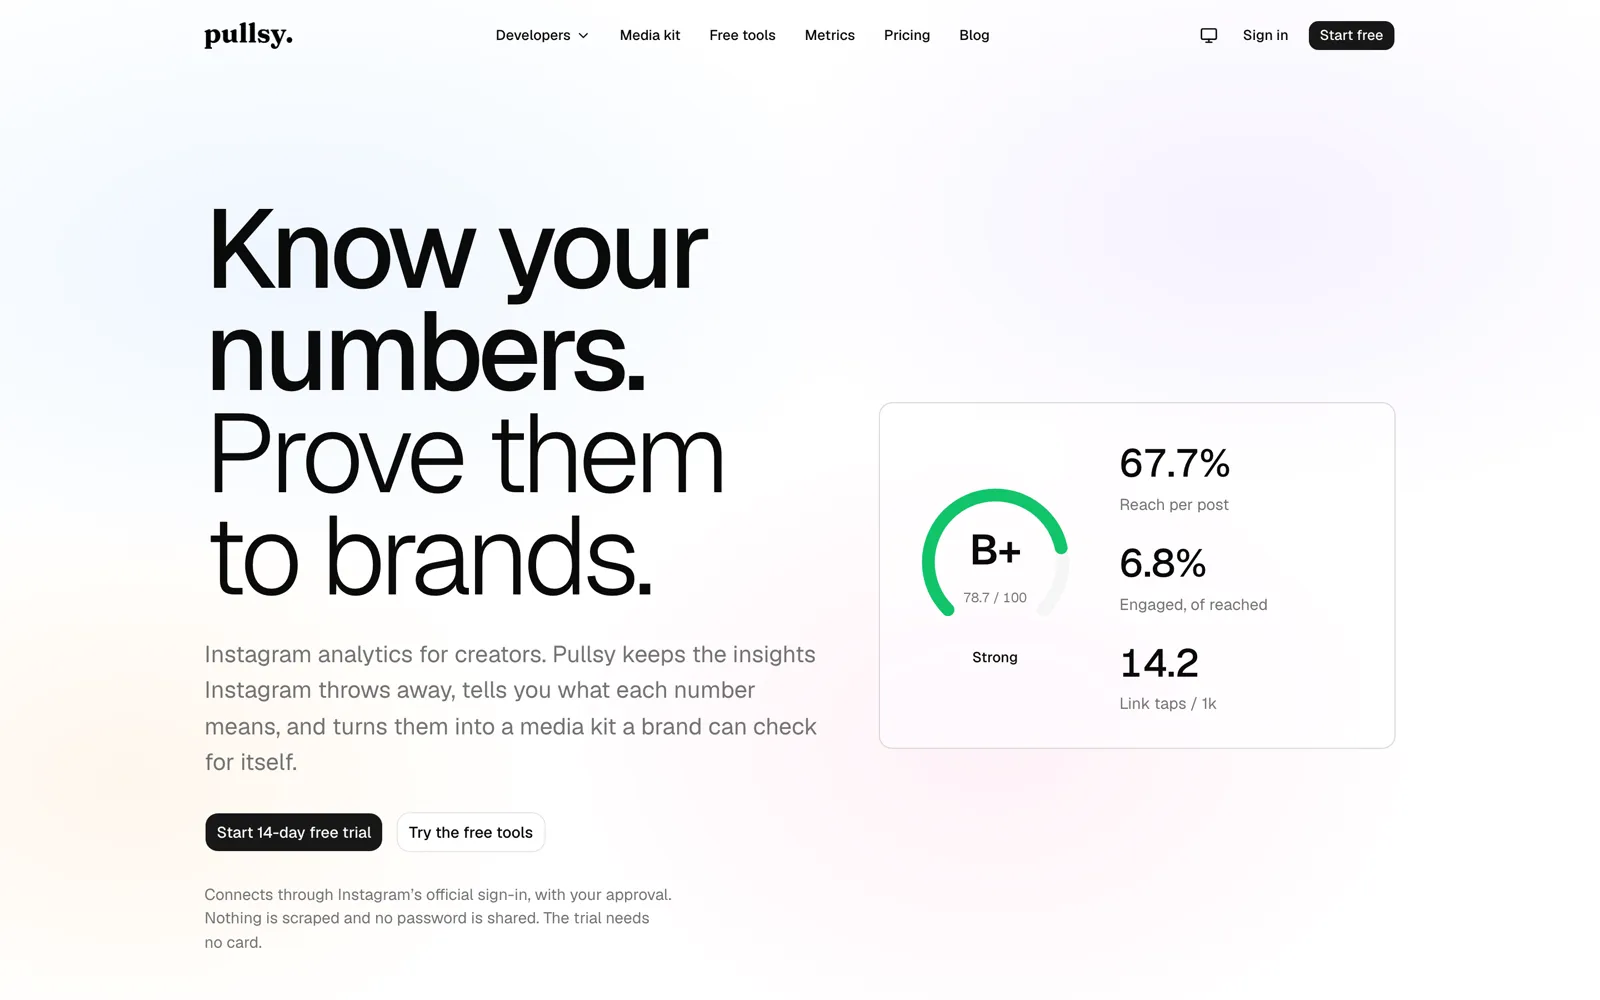
Acasa Labs does custom dashboard development: live operational dashboards, customer-facing analytics, and admin views built on your own data. A private options trading platform streams market state to a dashboard we built, Pullsy turns Instagram data into an account grade, and NoteTube shows educators their earnings and payouts.
The problem
A dashboard nobody trusts is a dashboard nobody opens.
Most dashboards fail the same way. The number on the screen does not match the number in the spreadsheet, the data is a day old, or the page is too slow to load. After that, people go back to asking someone to pull a report. A dashboard is worth building when the data pipeline under it is reliable, each metric is defined once, and it loads fast enough to become part of someone's routine.
What we build
- 01
Live operational dashboards
Data that updates as it changes, over WebSockets or server-sent events, throttled so a burst does not freeze the browser.
- 02
Customer-facing analytics
Charts and reports inside your product, scoped to each customer, that explain what a number means instead of only showing it.
- 03
The pipeline under the charts
Scheduled syncs, retries, and storage that keeps history, so the dashboard can show data you would not otherwise have.
- 04
Admin and money views
Earnings, payouts, usage, and queue health, for the people who run the business and need to know what happened today.
From production
From dashboards we built.
A dashboard that cannot slow the core
Options trading platformMarket state reaches the trading platform's Next.js dashboard through Redis and a WebSocket gateway throttled per instrument. The publisher drops when full, and if the gateway dies, trading does not notice.
Research on the same data
Options trading platformThe same platform keeps a Parquet tick archive queried with DuckDB and Polars, and a dashboard for comparing runs and building strategies visually.
Numbers that outlive the source
PullsyPullsy keeps Instagram insights that Instagram discards after about 90 days, and a scoring service turns the raw metrics into a grade and a media kit a brand can verify.
Money views for sellers
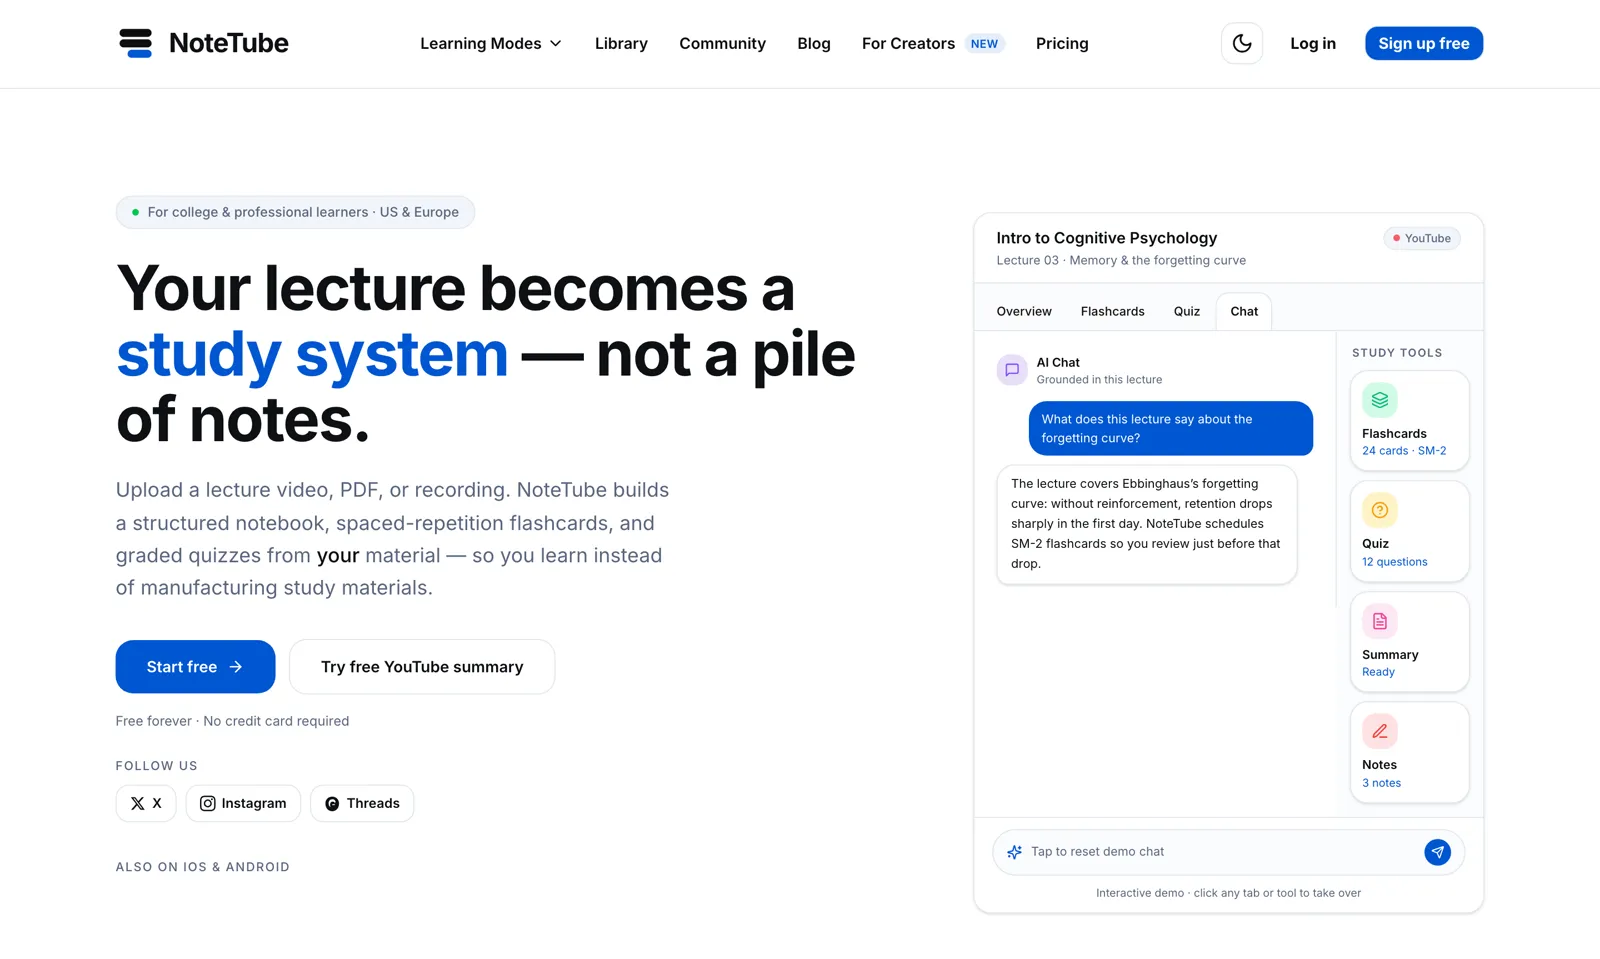
NoteTubeEducators selling study material on NoteTube get balances, payouts, and earnings dashboards over Stripe Connect.
Honest trade-offs
When a BI tool is enough
If the audience is internal, the data already sits in one database, and nobody needs it live, a BI tool like Metabase or Looker Studio pointed at that database may be all you need, and it costs far less. Build a custom dashboard when it is part of your product, when customers see it, when it has to be live, or when the data must be pulled, cleaned, and kept from several sources first.
What we reach for
- Next.js, React
- WebSockets, server-sent events
- FastAPI
- Postgres, Redis
- Parquet, DuckDB, Polars
- Prometheus, Grafana
- Stripe Connect
Proof
Shipped, not pitched.
01Client work
Options trading platform
Microsecond market-data handling for index options, with risk checks that never sleep.
A private trading platform for index options on an Indian exchange: tick capture, research and backtesting, paper and live execution, and a control dashboard. Built for a client's internal use; details are anonymized.
Trading engine · Realtime gateway · Web dashboard
02Our product
Pullsy
Instagram analytics that keep the numbers Instagram throws away.
Analytics for creators. Pullsy keeps insights Instagram discards after about 90 days, explains what each number means, grades the account, and turns it into a media kit a brand can verify.
Web · iOS (native SwiftUI) · REST API
03Our product
NoteTube
A lecture becomes a study system: chat, flashcards, quizzes, all grounded in the source.
An AI learning platform that turns PDFs, YouTube lectures, recordings, and notes into a structured notebook with grounded chat, spaced-repetition flashcards, and graded quizzes.
Web · iOS · Android · Chrome extension · MCP server
Questions
Dashboard development questions we get asked.
Can the dashboard show live data?
Yes. We stream updates over WebSockets or server-sent events and throttle them, so the browser gets what a person can read, not every tick. On the trading platform, the stream is throttled per instrument.
Can our customers see their own dashboard inside our product?
Yes. Customer-facing dashboards are scoped to each account on the server, so one customer's data never reaches another customer's browser.
Our data is spread across several tools. Can you still build this?
Yes, and most of the work is often there: scheduled syncs from each source, cleaning, and one place to keep the history. Pullsy's dashboard exists because its sync engine keeps data Instagram throws away.
Do you also build monitoring dashboards for our systems?
Yes. The trading platform's latency is instrumented across 12 stages and exported to Prometheus and Grafana with alert rules. We set up the same kind of view for the systems we build.
Will the numbers match our reports?
We define each metric once, in writing, with you, and compute it in one place. The dashboard and any exported report read from the same definition.
Custom dashboard development
Which number do you check first every morning?
Tell us where it comes from today and who needs to see it. We will tell you how we would get it on one screen, live.