Business analytics dashboard development
The numbers you ask for every Monday, already on the screen.
Acasa Labs does business analytics dashboard development: we pull the numbers you check every week out of your systems on a schedule, keep the history, and show them on one screen with what each number means. Pullsy keeps Instagram insights long after Instagram drops them, and we built the research dashboard for an options trading platform.
The problem
Every report starts with someone exporting three files.
You want to know how this month compares with last month. Someone exports from the sales system, the accounts software, and a spreadsheet, lines them up by hand, and sends a file on Monday. By then the numbers are a week old, and each person's version is slightly different. Some tools only keep a few months of history, so the year-on-year view you want does not exist anywhere.
What we build
- 01
Data pulled in on a schedule
Numbers collected from your systems through their APIs or exports, automatically, so nobody assembles the report by hand.
- 02
History you keep
Data stored in your own database, so you keep the history even when the source tool drops it.
- 03
Numbers that explain themselves
Each metric with a plain definition and a comparison, so a number on the screen leads to a decision, not a question.
- 04
Alerts when something moves
A message when a number crosses a line you set, so you hear about the problem before the Monday meeting.
From production
Dashboards we have built and run.
Keeping what the source throws away
PullsyInstagram keeps detailed insights for about 90 days. Pullsy pulls them on a schedule through Instagram's official sign-in and stores them long after Instagram forgets them.
A grade, not just a chart
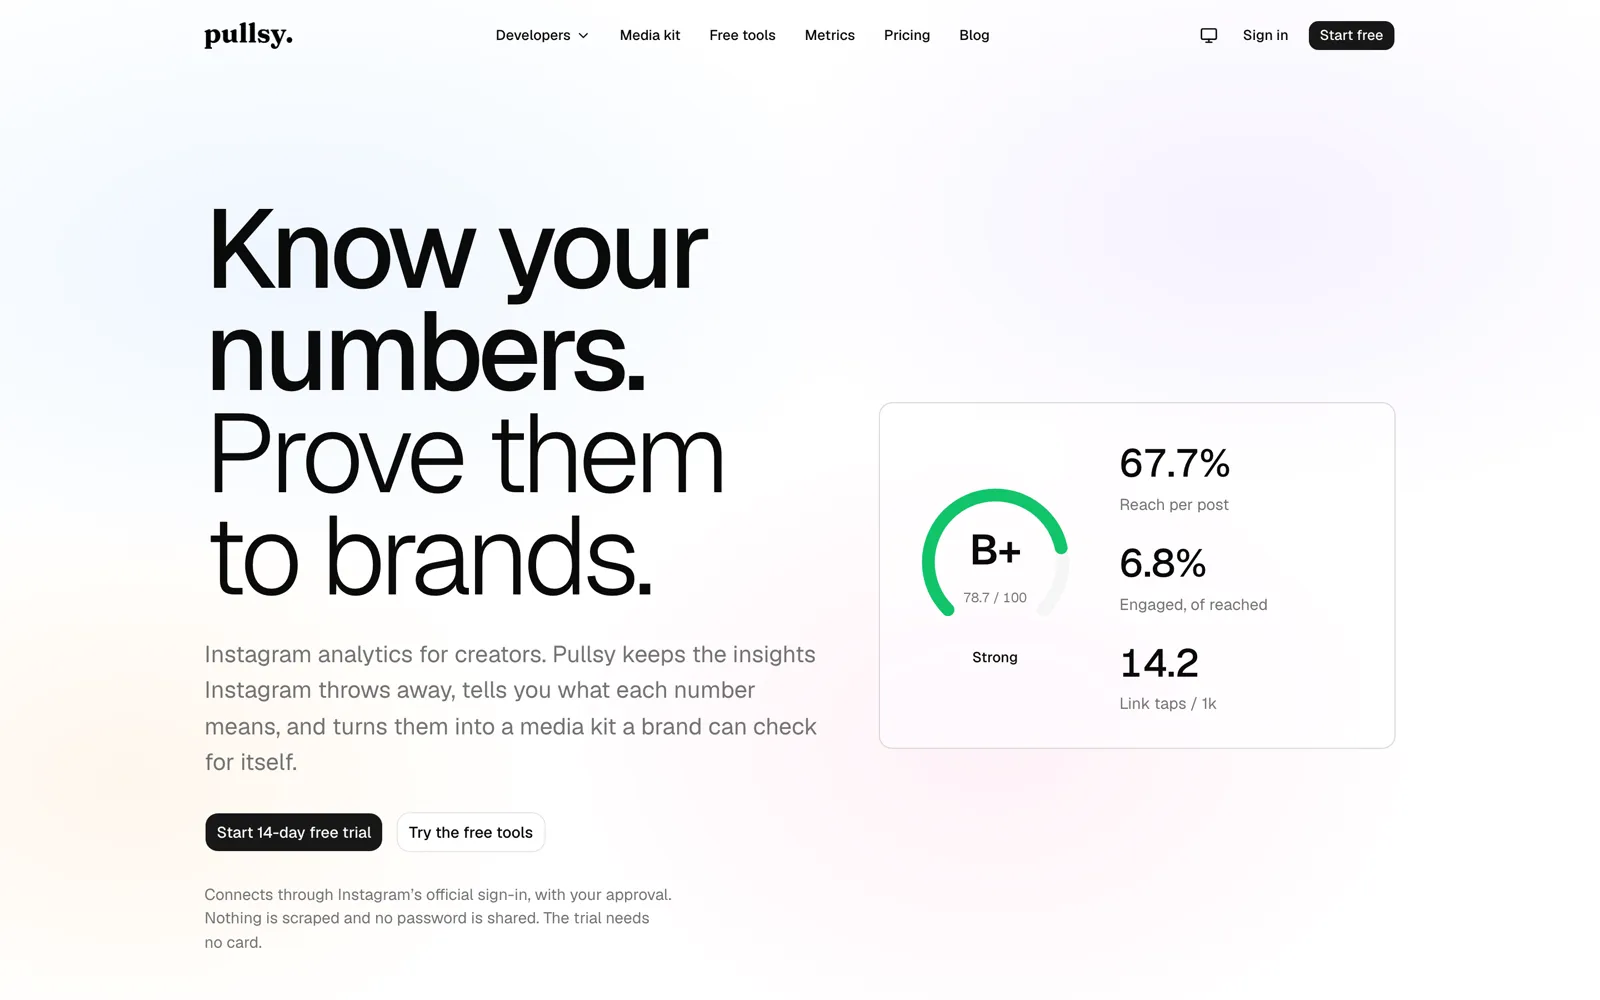
PullsyPullsy's scoring service turns raw metrics into a grade and a media kit that brands can check for themselves, so the numbers come with a meaning.
Research on the same data
Options trading platformFor an options trading client, a Parquet tick archive is queried with DuckDB and Polars, behind a dashboard for comparing runs and building strategies visually.
Alerts on the numbers that matter
Options trading platformThe same platform measures latency across 12 stages with exact percentiles, exported to Prometheus and Grafana with alert rules, so a slowdown is flagged, not found later.
Honest trade-offs
Power BI, Looker Studio, or a custom dashboard?
If your data already sits in tools that connect to Power BI or Looker Studio, and the people reading it are comfortable there, start with those. A custom dashboard pays off when the data needs work before it can be charted, when the source drops history you need, when the dashboard goes to your customers as part of your product, or when the numbers have to trigger action, not just be looked at.
What we reach for
- Next.js
- FastAPI
- Postgres
- DuckDB, Polars
- Redis
- Prometheus, Grafana
Proof
Shipped, not pitched.
01Our product
Pullsy
Instagram analytics that keep the numbers Instagram throws away.
Analytics for creators. Pullsy keeps insights Instagram discards after about 90 days, explains what each number means, grades the account, and turns it into a media kit a brand can verify.
Web · iOS (native SwiftUI) · REST API
02Client work
Options trading platform
Microsecond market-data handling for index options, with risk checks that never sleep.
A private trading platform for index options on an Indian exchange: tick capture, research and backtesting, paper and live execution, and a control dashboard. Built for a client's internal use; details are anonymized.
Trading engine · Realtime gateway · Web dashboard
Questions
Analytics dashboard questions we get asked.
Which systems can a dashboard pull from?
Anything with an API, a database we can read, or a regular export: sales, accounting, ads, analytics, and spreadsheets. We list your sources in the first call.
How fresh is the data?
As fresh as the source allows and you need. Most business dashboards refresh hourly or daily. Some sources, like ad platforms, limit how often they can be pulled.
Can our customers see a dashboard too?
Yes. A customer-facing dashboard sits in your product with each customer seeing only their own data, as Pullsy users see their own account's numbers.
Can we still use Excel or Power BI?
Yes. The data we collect sits in your database, so Excel, Power BI, or Looker Studio can connect to it as well.
Who owns the data?
You do. It is stored in a database on your account, not in a tool we control.
Business analytics dashboard development
Which numbers do you ask for every week?
Thirty minutes on the reports you build by hand. You leave with a written plan: scope, timeline, and a number.