FastAPI performance optimization
Measure first. Then fix the part that is actually slow.
Acasa Labs does FastAPI performance work: we measure where the time goes, then fix the event-loop blocking, slow queries, and missing queues behind it. The habit comes from systems where latency matters, like our options trading platform, which has latency instrumented across 12 stages, with exact percentiles exported to Prometheus and Grafana.
The problem
A slow FastAPI app is rarely slow because of FastAPI.
When a FastAPI service gets slow, the cause is usually one of a few things: a blocking call inside an async route that stalls every request on that worker, a query that loads a whole table, a third-party API called inside the request, or a job that should have been on a queue. Adding servers hides it for a month. Guessing wastes a week. The fix starts with numbers: p50 and p99 per route, time spent in the database, and time spent waiting on other services.
What we build with FastAPI
- 01
A performance audit
Latency percentiles per route, a profile of the slow paths, query plans, and a written list of fixes ranked by what each one will save.
- 02
Event-loop fixes
Blocking calls moved off async routes, sync drivers swapped for async ones where it matters, and CPU-heavy work moved to threads or worker processes.
- 03
Query and data fixes
Repeated per-row queries removed, indexes added from real query plans, pagination on every list, and caching where the data allows it.
- 04
Work moved off the request
Slow third-party calls, imports, and model calls moved to queues with retries, so the API answers fast and the work still gets done.
From production
Performance habits from systems we run.
Percentiles, not averages
Options trading platformThe trading platform has latency instrumented across 12 stages with exact percentile reservoirs, exported to Prometheus and Grafana with alert rules. An average hides the slow requests that users actually feel.
Nothing blocking on the loop
Options trading platformMarket-data decode runs on its own thread and is handed to the engine loop thread-safely, so nothing blocking ever sits on that loop. It is the same rule we apply to FastAPI's event loop.
Never the same job twice
PullsyPullsy's sync runs on a Redis queue with per-connection locks, so one account never syncs twice at once, and Meta's errors back off with jitter instead of retrying in a tight loop.
Read less, spend less
SigmaCPMSigmaCPM retrieves candidate pages before extraction, so the model reads the right pages of a tender instead of the whole package, and every LLM call records its tokens and cost.
Honest trade-offs
When the fix is not in FastAPI
Sometimes the API is fine and the database is the bottleneck, and the fix is an index or a schema change. Sometimes the hot path needs a compiled language: the trading platform is built on a Rust-core event engine, with order logic kept portable to Rust. And sometimes the honest answer is that the service is fast enough and the time is better spent on something else. We will say so.
What we reach for
- py-spy, cProfile
- Prometheus, Grafana
- OpenTelemetry tracing
- Postgres EXPLAIN ANALYZE
- Redis caching and queues
- asyncpg, SQLAlchemy async
- Locust or k6 load tests
Proof
Shipped, not pitched.
01Client work
Options trading platform
Microsecond market-data handling for index options, with risk checks that never sleep.
A private trading platform for index options on an Indian exchange: tick capture, research and backtesting, paper and live execution, and a control dashboard. Built for a client's internal use; details are anonymized.
Trading engine · Realtime gateway · Web dashboard
02Our product
Pullsy
Instagram analytics that keep the numbers Instagram throws away.
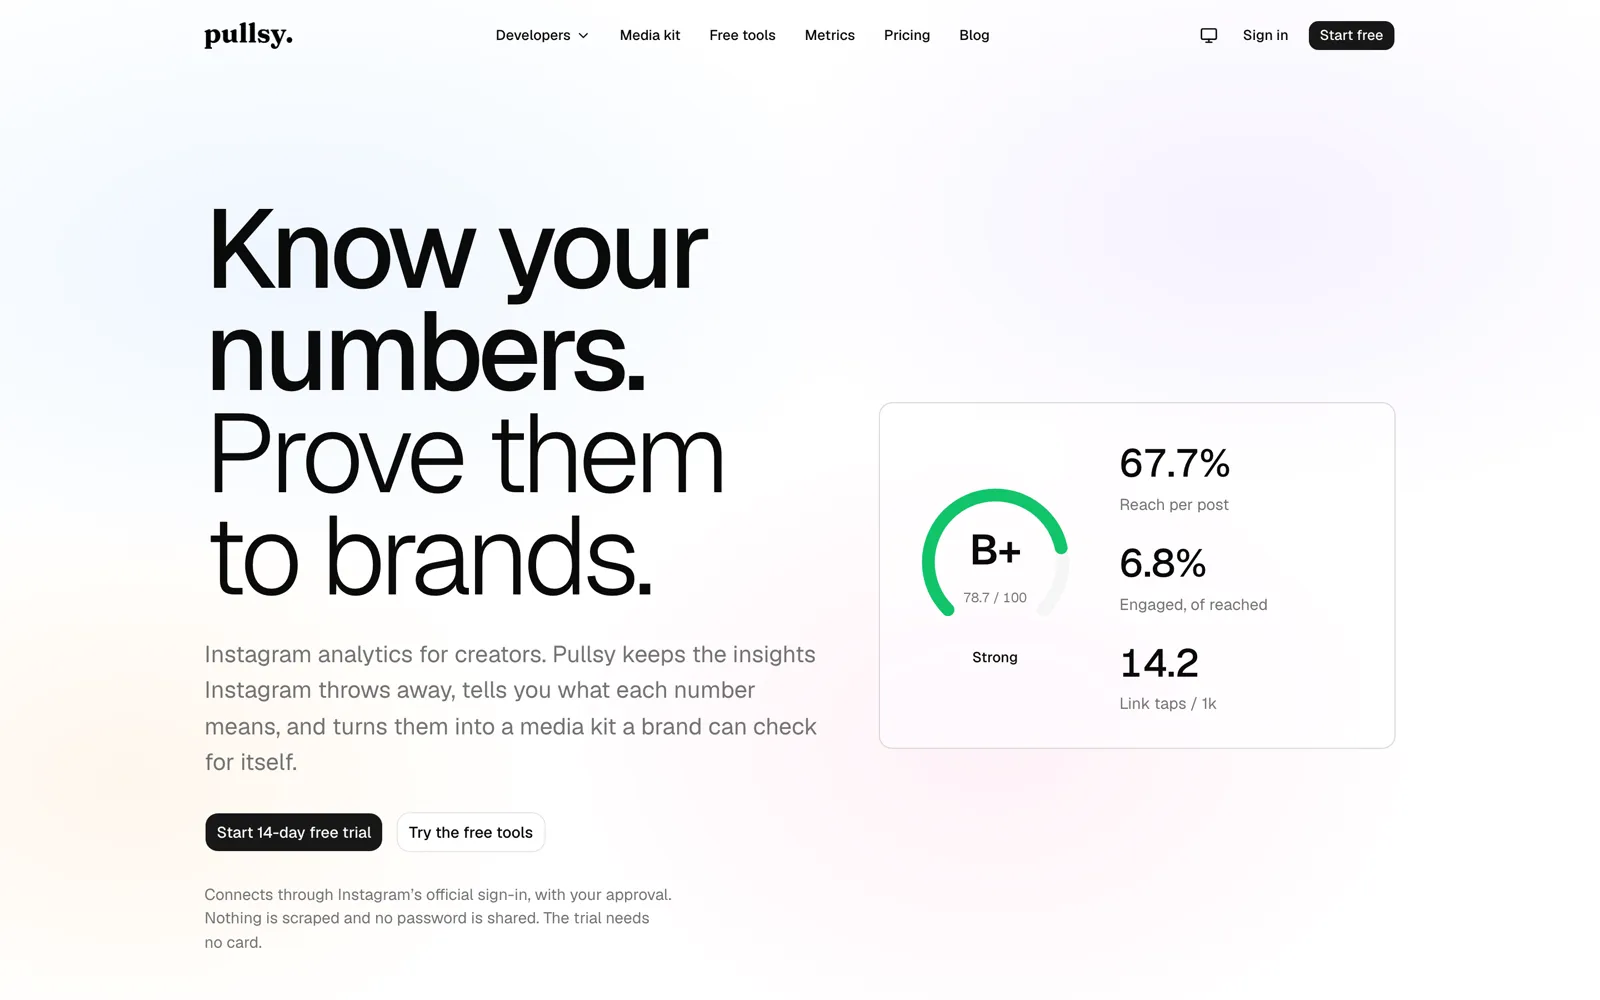
Analytics for creators. Pullsy keeps insights Instagram discards after about 90 days, explains what each number means, grades the account, and turns it into a media kit a brand can verify.
Web · iOS (native SwiftUI) · REST API
Questions
FastAPI performance questions we get asked.
Why is our FastAPI app slow?
Most often a blocking call inside an async route, a slow or repeated database query, or a slow third-party call inside the request. A profile and per-route percentiles usually point at which one.
Is FastAPI fast enough for high traffic?
Yes, for most APIs. The framework adds little overhead. Throughput is decided by what each request does, how much it waits, and how many workers you run.
What do you need from us for a performance audit?
Read access to the repository, metrics or logs from production if you have them, and the routes or jobs that feel slow. If there are no metrics yet, adding them is step one.
Will you rewrite our service?
Rarely. Most gains come from a handful of targeted fixes. A rewrite is on the table only when the numbers say the design itself is the limit.
Can you set up monitoring so this does not happen again?
Yes. Latency percentiles per route, alert rules on the routes that matter, and dashboards your team can read, in Prometheus and Grafana or the tools you already use.
FastAPI performance optimization
Bring the slow endpoint.
A free 30-minute call on your FastAPI service and where it hurts. You leave with what we would measure first and what fixing it would take.